Findapeach.com — Original Research
Which states and cities produce the most OnlyFans creators? A state-by-state and city-by-city analysis of creator counts, population-adjusted density rankings, and what the U.S. distribution of the world's biggest creator platform actually looks like.


At Findapeach.com, we operate at the intersection of data science and adult content. As one of the leading metasearch engines for OnlyFans and their over 400 million monthly visitors, we focus on the platform's most active creators - a number closer to 682,000 who are regularly publishing and monetizing their work. This unique position gives us a front-row view of both the creator and consumer sides of the industry.
The United States is home to the largest concentration of OnlyFans creators anywhere in the world - an estimated 347,223 active models generating over $3 billion in annual creator revenue, accounting for 52.3% of the global platform total. But that national figure hides enormous variation. This page breaks the US down by all 50 states and the top 100 creator cities to answer: Where exactly are America's creators, and which places punch above their weight?
The dataset combines our proprietary scraper (which continuously crawls OnlyFans for creator data) with a third-party export of verified profiles. We applied strict inclusion criteria for active accounts: login activity within the last 6 months, at least 5 posts or media items, and no inactive or closed status. This means the dataset represents creators who are actively trying to generate revenue on the platform - not every account ever registered. Free-text locations were cleaned and standardized (e.g., "Chicago" becomes Chicago; whimsical entries like "Hogwarts" or "North Pole" are marked Unknown).
City-level entries are validated against a master reference database to ensure only genuine cities appear in the rankings - state names, territories, and regional descriptors are excluded. Comparisons use metro-area populations (sourced from Macrotrends) rather than strict city limits, as creators typically self-identify with the nearest major hub (e.g., Evanston creators list "Chicago"; Fort Lauderdale creators often say "Miami"). Boroughs and satellite areas are aggregated into parent metros (e.g., Brooklyn merges into New York City; the DMV area rolls into Washington, D.C.). State populations use US Census Bureau estimates.
The results provide the most detailed publicly available breakdown of where America's OnlyFans creators are concentrated - both in absolute numbers and on a per-adult-population basis.
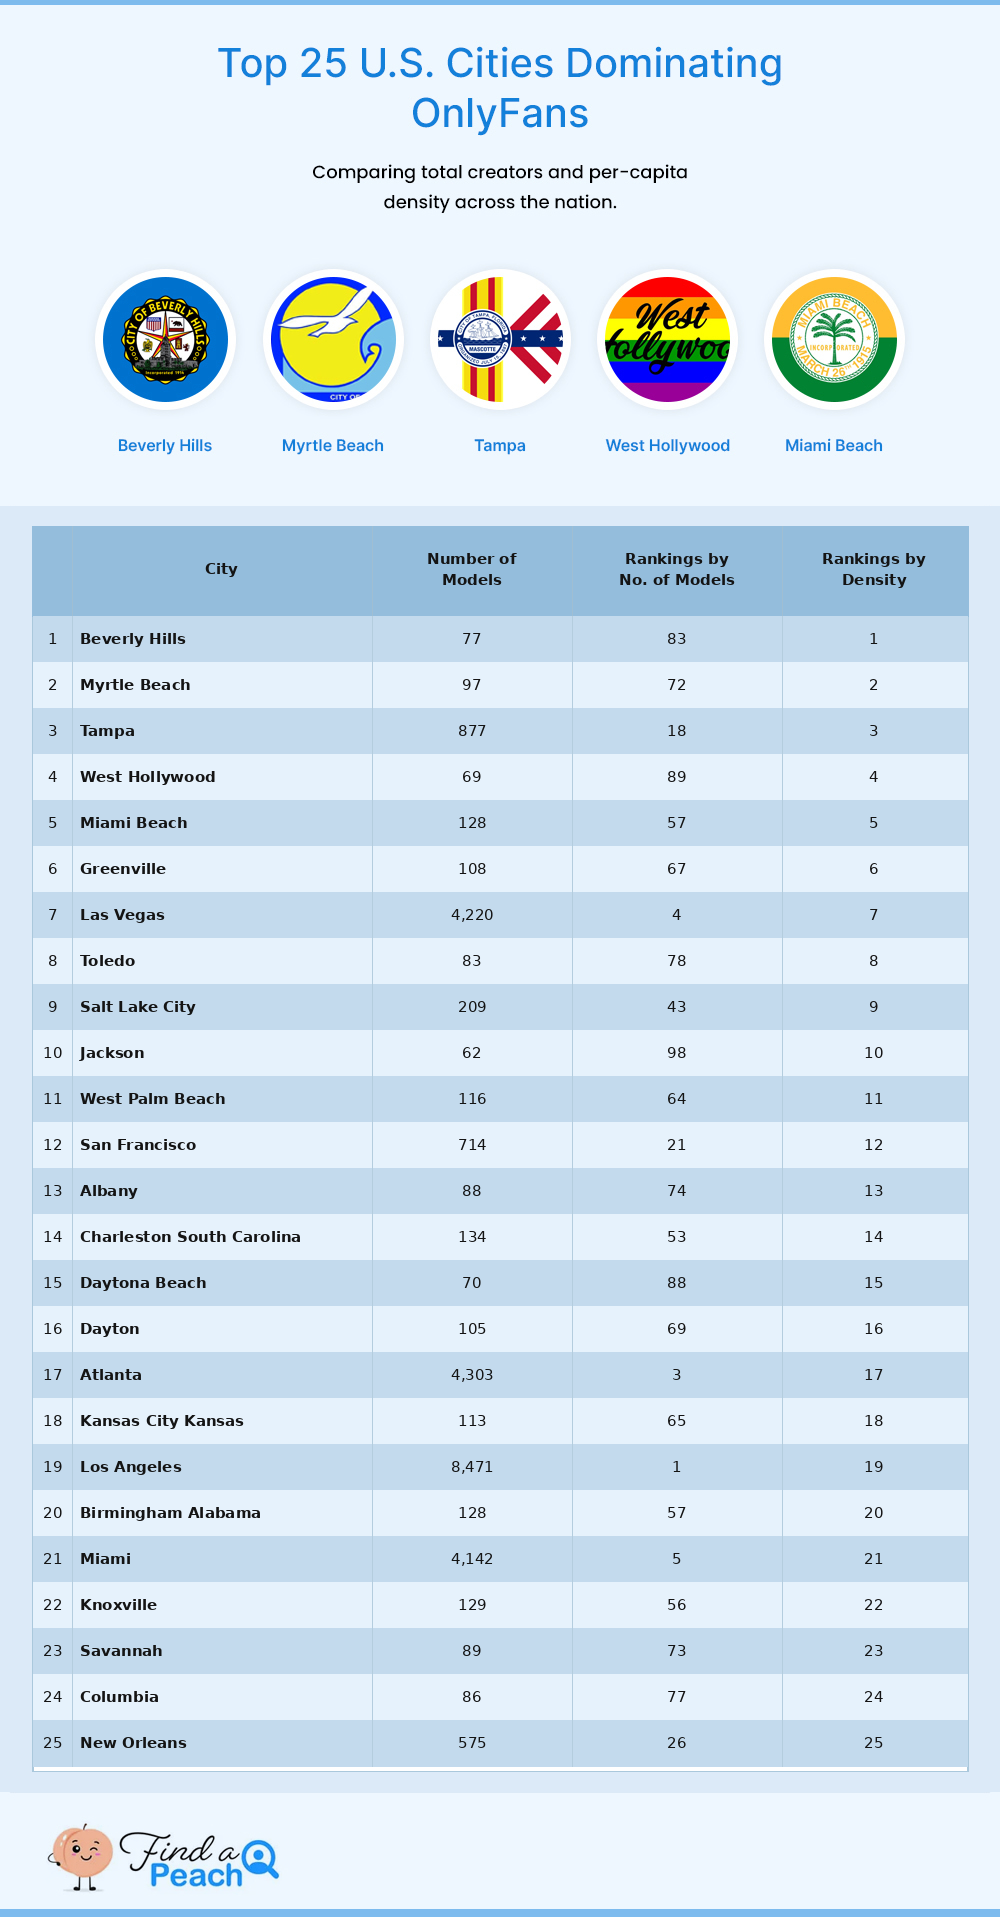
The Total Models figures in the tables below are extrapolated estimates that account for creators who don't list a location. The profile counts shown on individual Findapeach pages are observed (raw) counts. Both are valid - they answer different questions. For definitions, formulas, and caveats, see the Methodology section at the bottom of the page.

A complete, plain-language explanation of every column in the US States and Top 100 US Cities tables - where each number originates, how it is calculated, and what it represents.
The US States and Top 100 US Cities analyses are subsets of the same underlying dataset used for the Country Analysis and Top 100 Global Cities tables. The same raw profiles, the same extrapolation approach, and the same revenue modelling apply. Two important adjustments are made for US-specific analysis.
This dataset does not include every account registered on OnlyFans. Only profiles that meet an activity threshold are included: a minimum of 5 posts, images, or videos published, and the account must have been active within the last 6 months. This filters out dormant, abandoned, or placeholder accounts and ensures the data reflects creators who are actively trying to generate revenue. There are significantly more accounts registered on OnlyFans than appear in this analysis, but those that do not pass this activity test are excluded.
Rather than using the global $5.76B revenue pool, the US analyses use a US-specific revenue pool derived from the Country Analysis: the United States accounts for 52.3% of the global platform revenue estimate - $3,014M of the $5,760M global total. All state and city revenue figures are distributed from this US pool.
Using a US-specific pool prevents the state-level revenue figures from exceeding the country-level US total. All 50 states' revenues sum to approximately $3,014M - consistent with the Country Analysis figure for the United States.
Not every profile contains a usable location field. Observed counts are scaled up using a coverage rate computed at runtime from the actual dataset - not a hardcoded constant. This is the same approach used in the Country Analysis.
The Total Models figures in these tables are extrapolated estimates designed to represent the full creator population, including those who don't list a location. The profile counts visible on the site are observed counts - the actual number of profiles that list a given location. Both numbers are valid; they answer different questions.
For example, if 60,000 profiles list California as their location but only ~55% of all profiles include a location, the extrapolated California total would be approximately 60,000 ÷ 0.55 ≈ 109,000. The site shows ~60,000 (observed); the state analysis shows ~109,000 (extrapolated). Neither is wrong - the extrapolated figure estimates the true total including unlisted creators.
For the US States table, an additional correction ensures that the sum of all 50 state totals equals the US country-level total from the Country Analysis. Some profiles list a US location (e.g. "United States") without specifying a state. A state specificity uplift distributes these unattributed profiles proportionally across states:
For the Top 100 US Cities table, the same two-stage approach is applied with a city specificity uplift. Many profiles resolve to a US state but not a specific city. The uplift distributes these proportionally:
Both stages of extrapolation assume that creators who omit detail are distributed in the same proportions as those who provide it. If creators in specific states or cities are systematically more or less likely to list detailed locations, the corresponding estimates will be affected.
Revenue is distributed using the same engagement-weighted approach as the global analysis - each location receives a share of the US revenue pool proportional to its combined subscriber and follower engagement score.
Like the global figures, these are arithmetic means pulled upward by a small number of top earners. The typical creator in any state or city earns substantially less than the stated average.
States or cities ranked #1 downward by estimated total creator count. California, Florida, and Texas typically dominate by raw count due to their large populations.
Ranked by creators per 100,000 adult residents. States with smaller populations but high engagement often rank higher here than by raw count.
For the Top 100 US Cities table, city population figures are sourced from Macrotrends and use metropolitan area populations rather than city-centre-only figures. This is because creators tend to list the nearest major city as their location rather than the specific outer-suburban municipality they live in. A creator in Arlington, Texas, for example, will typically list "Dallas Fort Worth" rather than a smaller local area name. Using metro populations ensures that density calculations reflect the realistic catchment area that each city name represents in the data.
Gender classification uses automated image recognition applied to each model's profile photo, combined with any gender-affirming statement present in the profile. Where both signals are available, stated gender takes precedence as the authoritative source. Image recognition provides coverage where no gender is explicitly stated.
Profiles identified as Trans - either through stated gender or image recognition - are classified first and excluded from subsequent steps.
Remaining profiles identified as Male via stated gender or image recognition are classified as Male.
All remaining profiles are classified as Female based on stated gender or image recognition output.
Within Male profiles: those whose profile data contains the keyword "gay" are counted under % Male Gay. This is calculated as a share of all male profiles for that location.
Within Female profiles: those whose profile data contains "lesbian" or "girl/girl" are counted under % Female Lesbian. This is a share of all female profiles for that location.
All gender percentages in the US States and Top 100 US Cities sheets are
stored as direct percentage
values (e.g. 82.89 = 82.89% female).
Per-model averages computed across all profiles in each state or city with a non-null value for that field.
| Column | Definition |
|---|---|
| Avg Price | Mean monthly subscription price in USD |
| Avg Followers (Per Model) | Mean total follower count per profile |
| Avg Subscribers (Per Model) | Mean paying subscriber count per profile |
The following three columns appear in the Top 100 US Cities table only (they are not included in the US States sheet).
The applicable city or state minimum wage for that location in USD, annualised (hourly rate × 2,080 hours). States without their own minimum wage above the federal floor use the federal figure.
For each US state, the analysis identifies a real local industry from Census Bureau data whose annual revenue is most comparable to the estimated OnlyFans creator economy in that state.
Industry revenue data is drawn from the US Census Bureau Economic Census, using the most recently published dataset covering fiscal year 2022 (published 2024-2025). The Census API is queried for detailed industry revenue by state using NAICS sector codes.
The name of the Census industry sector whose annual state revenue is closest to the estimated OnlyFans creator revenue for that state. Where necessary, two or more related industries may be combined to reach the closest comparable figure.
The annual revenue of that comparable industry in millions USD from the Census Bureau 2022 Economic Census.
The year of Census data used. Most entries show 2022; where 2022 data was unavailable, 2017 data is used.
The industry comparison provides scale context, not equivalence. It answers: "The OnlyFans creator economy in this state is approximately the same size as the [industry] industry here."
The Top 100 US Cities table adds two columns not present in the US States table.
A cost-of-living index for each US city, normalised so New York City = 100. Values reflect consumer price levels including rent, food, transport, and services.
Every candidate city is validated against a master city reference database. Non-city entries (territories, regions, sub-continents) are rejected. NYC borough entries are consolidated into a single New York City record. Cities are ranked by estimated total creator count, with the top 100 shown.
The Global Cities table ranks the top 100 cities worldwide. The US Cities table ranks the top 100 within the United States only. Los Angeles, New York City, and Las Vegas appear near the top of both, but density rankings differ because the global table uses international population benchmarks.
| Column in Spreadsheet | Type | Description |
|---|---|---|
| State | Raw | US state name; all 50 states are covered |
| Total Models | Extrapolated | Estimated total creators in this state (two-stage extrapolation) |
| Ranking (No. Models) | Calculated | State rank by estimated creator count; 1 = most creators |
| Ranking (By Density) | Calculated | State rank by creators per 100,000 adult residents |
| % Female | Calculated | Share of profiles classified as female, as a direct percentage (e.g. 82.89) |
| % Male | Calculated | Share classified as male (non-trans), as a direct percentage |
| % Trans | Calculated | Share with "trans" in gender field, as a direct percentage |
| % Male Gay | Calculated | Share of male profiles containing keyword "gay"; % of male profiles |
| % Female Lesbian | Calculated | Share of female profiles with "lesbian" or "girl/girl"; % of female profiles |
| Avg Price | Raw | Mean monthly subscription price in USD |
| Avg Followers (Per Model) | Raw | Mean total follower count per profile |
| Avg Subscribers (Per Model) | Raw | Mean paying subscriber count per profile |
| Yearly Revenue ($M) | Calculated | Estimated annual creator revenue for this state in millions USD |
| Comparable Industry | Reference | Census industry sector with revenue most comparable to OF creator economy in this state |
| Industry Revenue ($M) | Reference | Annual revenue of that industry in millions USD (Census Bureau) |
| Data Year | Reference | Year of Census data used; 2022 for most, 2017 where unavailable |
| Column in Spreadsheet | Type | Description |
|---|---|---|
| City | Raw | US city name, validated against master city reference database |
| Country | Raw | All entries are "United States" in this sheet |
| Total Models | Extrapolated | Estimated total creators in this city (two-stage extrapolation) |
| Rank (Models) | Calculated | City rank by estimated creator count within the US top 100 |
| Rank (Density) | Calculated | City rank by creator density relative to city adult population |
| % Female / % Male / % Trans | Calculated | Gender breakdown as direct percentages |
| % Male Gay / % Female Lesbian | Calculated | Keyword-based sub-category counts, as % of the relevant gender group |
| Avg Price | Raw | Mean monthly subscription price in USD |
| Avg Followers (Per Model) | Raw | Mean follower count per profile |
| Avg Subscribers (Per Model) | Raw | Mean paying subscriber count per profile |
| Yearly OF Model Revenue ($M) | Calculated | Estimated annual creator revenue for this city in millions USD |
| Avg Annual/Model ($) | Calculated | Estimated mean annual creator earnings |
| Min Wage/Yr ($) | Reference | Annual minimum wage applicable to this city in USD |
| % Diff vs Yearly Min Wage | Calculated | Percentage difference between avg model earnings and annual minimum wage |
| Cost of Living (NYC=100) | Reference | City cost-of-living index; NYC = 100 |
| Purchasing Power ($NYC) | Calculated | Avg annual earnings as NYC purchasing-power equivalent |
| Source | Used For | Link |
|---|---|---|
| OnlyFans | Publicly visible profile data (location, gender, price, followers, subscribers) | onlyfans.com |
| US Census Bureau Economic Census | State-level industry revenue data (NAICS codes, 2022 data) | census.gov/economic-census |
| US Department of Labor | Federal and state minimum wage rates | dol.gov/minimum-wage/state |
| US Census Bureau Population Estimates | State population figures, adult population ratios | census.gov/popest |
| Macrotrends | City metropolitan area population figures (used for city density rankings) | macrotrends.net |
| Numbeo | Cost of living indices by US city (NYC = 100 baseline) | numbeo.com/cost-of-living |
| OnlyFans Financial Reporting | Platform revenue estimates ($7.2B gross, 80% creator share) | fenixintl.com (Companies House filings) |